Sparkle Motion: A Thousand Points of Light
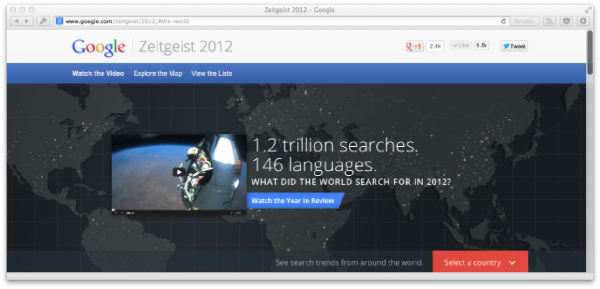
This year, we (Instrument) had the opportunity to work on Google's Zeitgeist site. Every year, Google collects the most popular and fastest rising search results and shares them with the world. The site features the results of "The World" & 55 different countries in a multitude of different languages (including several Right-to-Left languages) and is responsive across all browser sizes. Kudos to my teammates @stefhatcher and @waytoocrowded on managing this extraordinary task.
For my part, I worked on building the 3D Map Explore feature. I'll write more about what that involved later, but for now I want to discuss the static "twinkling lights" state that you'll see on the homepage.

Basically, there is a map with "lights" which pulse around the world. Here's the code I used for this, along with a demo. But I want to talk about a higher-level question. How do you draw points which fill in a map?
Option 1: Plot Data Points
The first option is to find a dataset which will cover and fill the land portions of the map. There are several good sources of data for plotting where people live.
You could plot the lat/long of every city. You could use a population density map.
Basically you just need a bunch of coordinates and then you draw them. I found cool list of airports and converted it to JSON.
Once you have your coordinates, you'll need to convert them from lat/long to x/y. This is an easy function:
function getXY(lat, lon) {
  var x = (lon * MAP_WIDTH) / 360;
  var y = (lat * MAP_HEIGHT) / 180;

  return { x: x, y: y };
}
Option 2: Read an Image
Sometimes, however, you'll need to cheat. When real data doesn't look quite right, just let a designer draw it and use that information in your visualization. This is the approach we actually used on the site.
The designer makes a map file and we read the coordinates in via canvas:
// Canvas to read pixels from.
var pixelmapLayer = document.createElement('canvas');

// Loadable map.
var myMapImg = new Image();

// Onload
myMapImg.onload = function() {

  // Make the canvas and image the same size
  pixelmapLayer.width = myMapImg.width;
  pixelmapLayer.height = myMapImg.height;

  // Draw the image on the canvas.
  var pixelmapCtx = pixelmapLayer.getContext('2d');
  pixelmapCtx.drawImage(myMapImg, 0, 0);

  // Read image data array from canvas
  var pmapImageData = pixelmapCtx.getImageData(0, 0,
                      pixelmapLayer.width,
                      pixelmapLayer.height);

  // Loop over RGBA values 4 at a time
  var len = pmapImageData.data.length;
  var mapDots = [];
  for (var i = 0; i < len; i += 4) {
    var r = pmapImageData.data[i],
        g = pmapImageData.data[i + 1],
        b = pmapImageData.data[i + 2],
        a = pmapImageData.data[i + 3];

    // If pixel is black and opaque, use it
    if ((r === 0) && (g === 0) && (b === 0) && (a >= 255)) {
      var pixel = Math.ceil(i / 4);

      // Map linear pixel number to 2d x/y
      var x = pixel % pixelmapLayer.width;
      var y = Math.floor(pixel / pixelmapLayer.width);

      mapDots.push({
        x: x,
        y: y
      });
    }
  }
};

myMapImg.src = 'pixel-map.png';
Now the designer can "paint" denser points in certain areas if he wants. For example, this effect could be behind text and the design may want to avoid twinkling lights there for readability.